The Quick Version
1,001 homes for sale. Now 4,442.
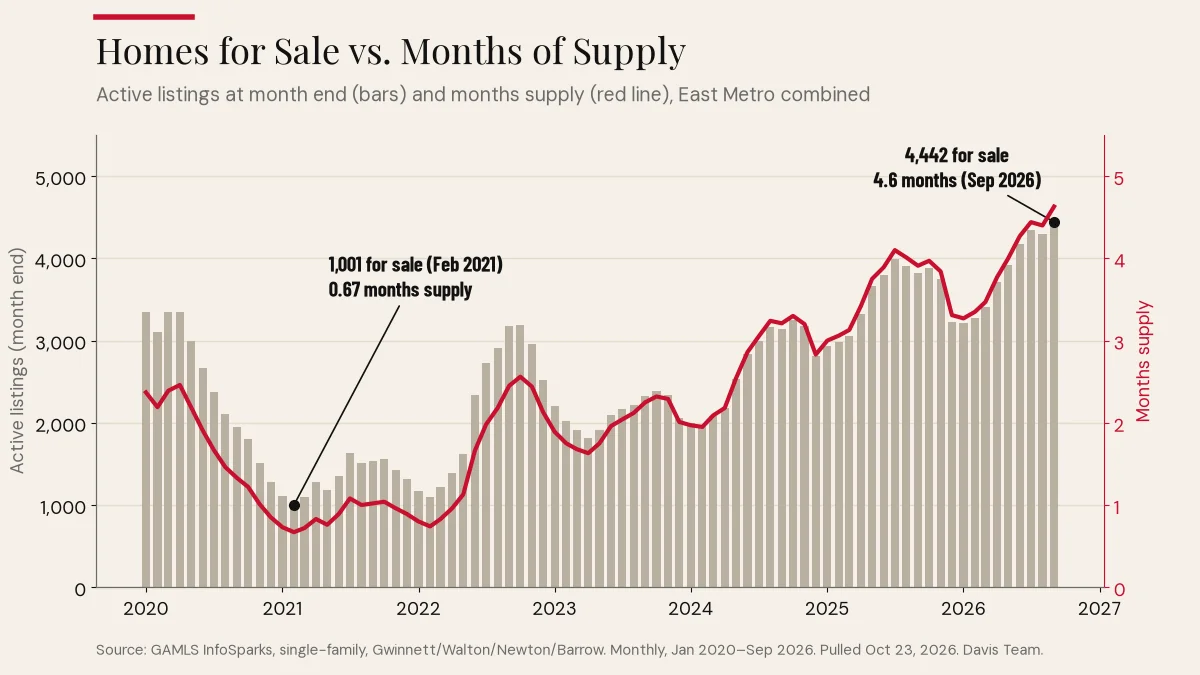
In February 2021, Gwinnett, Walton, Newton and Barrow combined had 1,001 single-family homes for sale at month end. That’s the whole East Metro shelf. In September 2026 it was 4,442, the most of any month since January 2020.
Months supply went from 0.67 to 4.6. Median days on market went from about 5 to about 44. The combined median price is about $398K, down from a peak of about $435K in June 2025.
That’s not a crash. That’s a market that stopped being crazy. Below: six years of real Georgia MLS data, five charts on what changed, and what to do about it whether you’re buying or selling.
Every number in this post comes from Georgia MLS (GAMLS) via InfoSparks, single-family, Jan 2020 to Sep 2026. “East Metro” here means Gwinnett, Walton, Newton and Barrow counties combined. Combined medians are weighted approximations, so we say “about.”
Chart 1 · Pricing
Prices ran hard, then went sideways
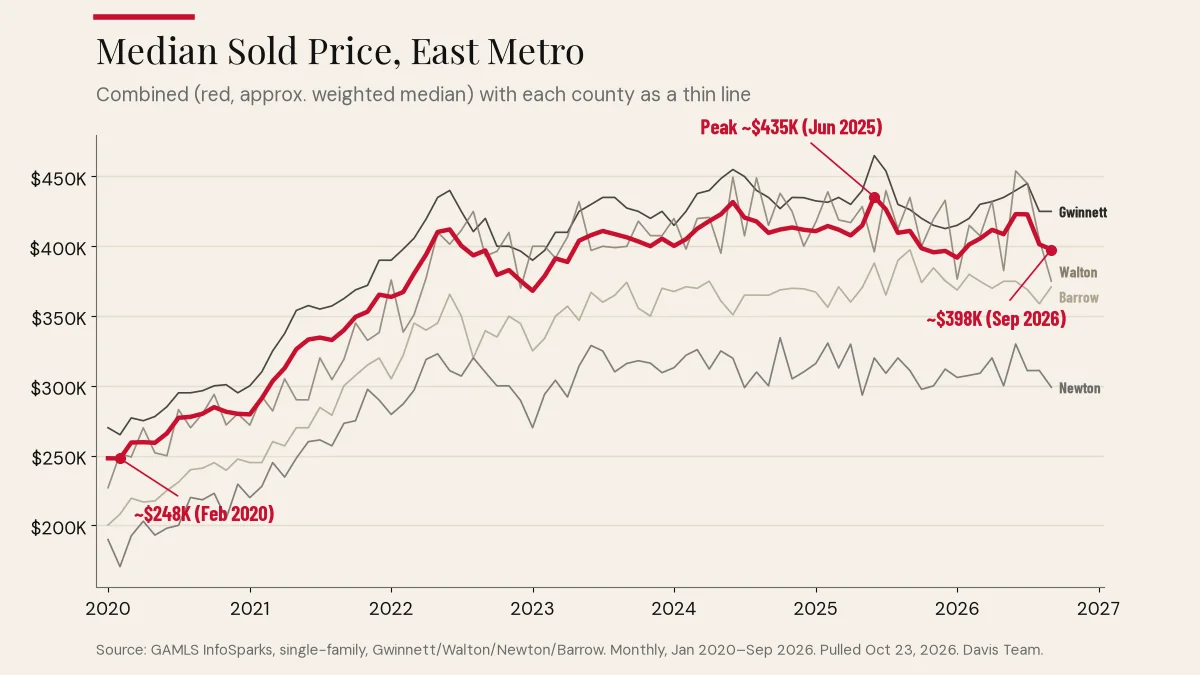
February 2020: the combined median sold price was about $248K. June 2025: about $435K. That’s the top of this six-year run.
Since then? It’s been chop, not a cliff. September 2026 came in at about $398K. A year earlier, about $411K. In September 2020, about $280K.
Here’s the part most headlines skip. Price per square foot didn’t drop. The combined median was about $175.5 a foot in September 2026 vs. about $174.3 a year earlier. The median price moves with which homes sell in a given month. The per-foot number says the value of a square foot held.
County by county, September 2026 vs. September 2025:
- Gwinnett: $425,000 vs. $426,240. Basically flat.
- Walton: $375,000 vs. $435,000. Big swing, but that’s one month and 98 closings. Walton’s own peak was $453,995 in June 2026, three months earlier. Don’t read a trend off one month in a small county.
- Newton: $299,000 vs. $311,000.
- Barrow: $370,950 vs. $397,450. September 2025 was Barrow’s six-year peak.
Prices are well above 2020 and a bit below the peak. That’s the honest read.
Chart 2 · Supply & Demand
The shelf filled back up
Months supply is simple: homes for sale divided by the average number going under contract each month over the past year. Low means buyers fight over scraps. High means buyers get to choose.
Now the twist. Sellers did not flood the market. Look at new listings in September of each year: 1,666 in 2020. 1,601 in 2025. 1,685 in 2026. Almost the same.
What changed is the other side. Pending sales, meaning homes that went under contract: 1,561 in September 2020. 946 in September 2025. 749 in September 2026.
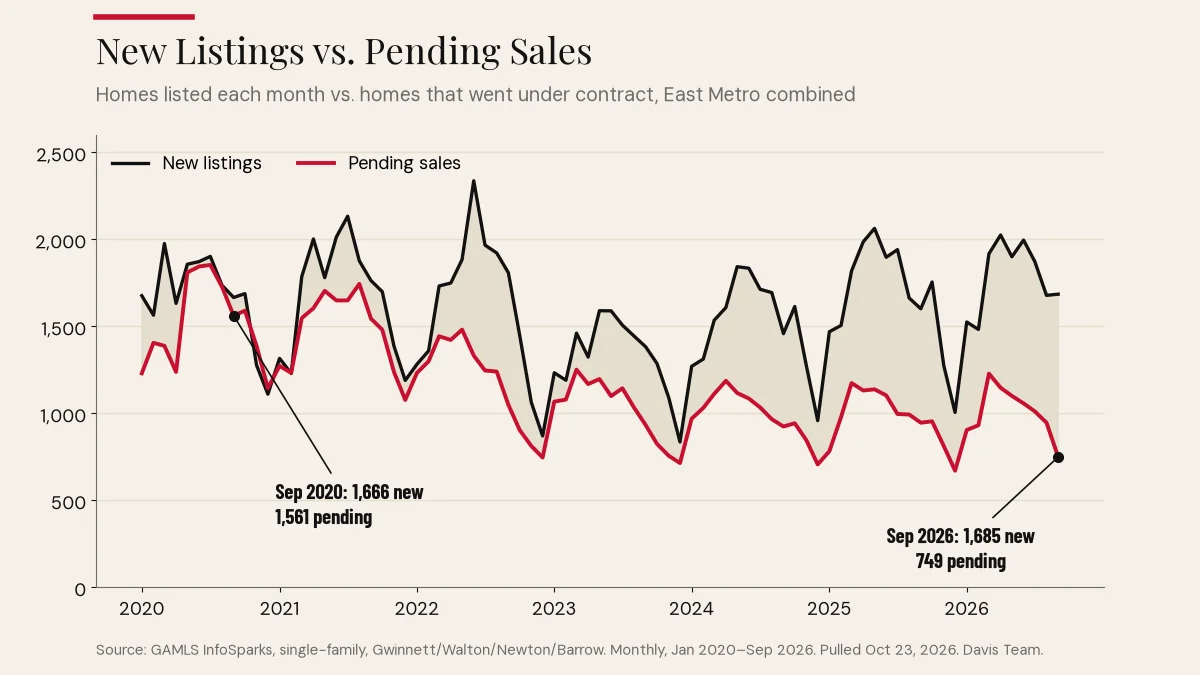
Full-year totals say the same thing. 2020: 19,955 new listings, 18,178 pendings. 2025: 19,979 new listings, 11,677 pendings.
Same number of homes coming on. Fewer going under contract. That’s where the 4,442 comes from.
Closed sales tell the same story: 874 in September 2026, 991 a year earlier, 1,651 in September 2020.
Chart 3 · Market Pace
From 5 days to 44
Days on market here means the median number of days from listing to accepted offer, counted across relists. It stops at the contract. It doesn’t count the weeks to closing.
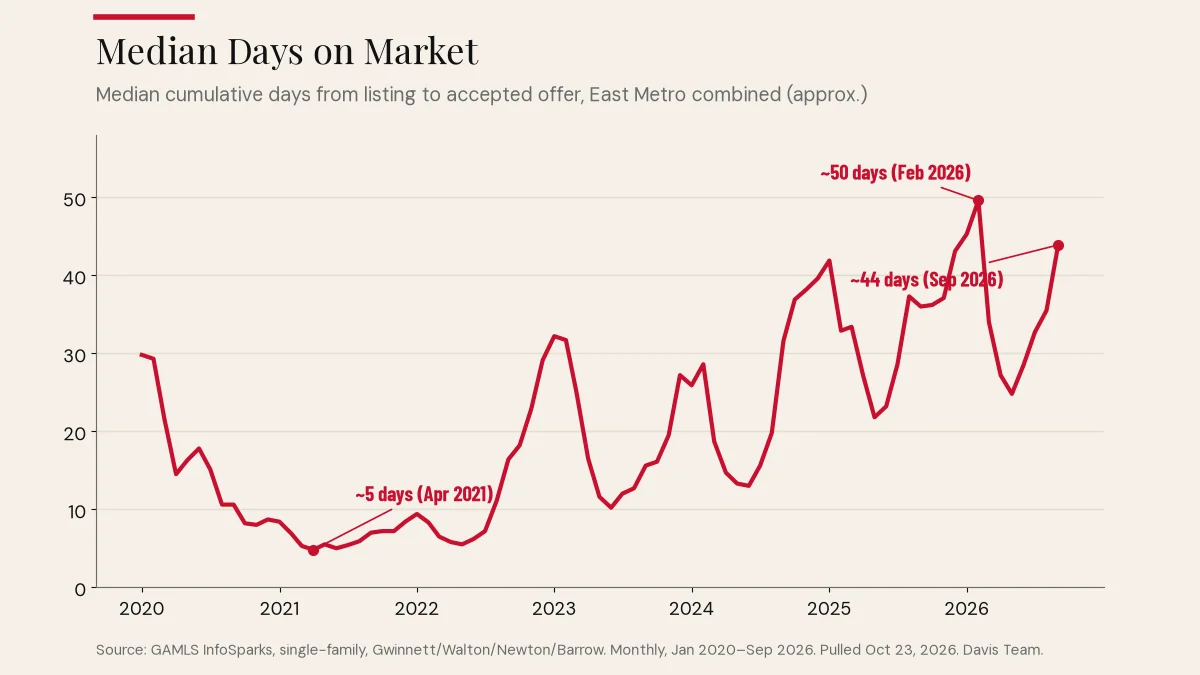
April 2021: about 5 days. September 2020: about 11. September 2025: about 36. September 2026: about 44. The slowest month of the whole six years was February 2026 at about 50 days. Winter is always slower. But every calendar year since 2021, the slowest month has been slower than the year before.
By county in September 2026: Gwinnett 42 days, Walton 57, Newton 30, Barrow 54. Newton actually got faster than a year ago (37 days in September 2025).
Chart 4 · What Sellers Actually Get
What sellers actually get vs. asking
This chart is the median sold price as a percent of the last list price. Read that word twice. If a home started high and got cut, this only compares the sale to the final asking price. A home relisted under a new listing number resets too. So this number makes negotiation look smaller than it really is.
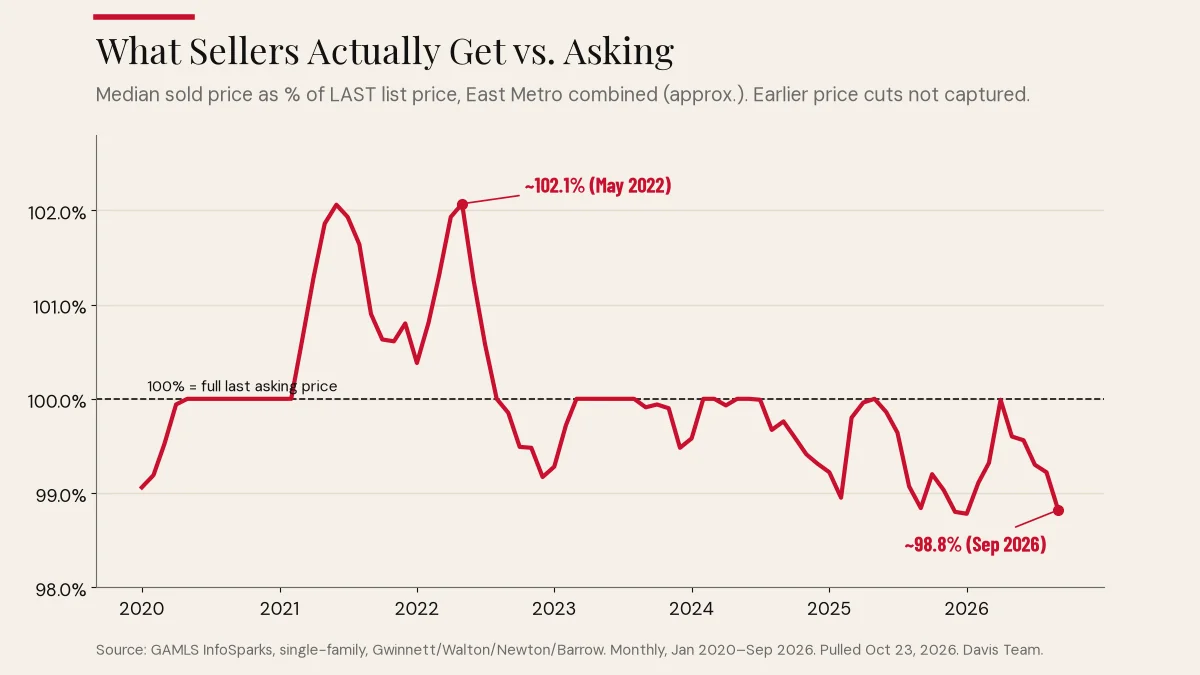
May 2022: about 102.1%. Buyers were paying over asking, as the typical outcome. In Gwinnett alone, the median hit 103.0% that month.
September 2026: about 98.8%. September 2025: about 98.8% too. So the gap between the final ask and the sale price hasn’t really widened in a year. The bigger change is what the data can’t see: how much sellers had to come down before that last price.
The typical home sells a little under its final price. Getting to the right final price is the whole game.
Sep 2026 at a Glance
The scoreboard
| Sep 2026 | East Metro* | East Metro Sep 2025* | Gwinnett | Walton | Newton | Barrow |
|---|---|---|---|---|---|---|
| Median sold price | about $398K | about $411K | $425,000 | $375,000 | $299,000 | $370,950 |
| Median $/sq ft | about $175.5 | about $174.3 | $176 | $191 | $154 | $179 |
| Homes for sale (month end) | 4,442 | 3,824 | 2,763 | 576 | 556 | 547 |
| New listings | 1,685 | 1,601 | 1,070 | 204 | 189 | 222 |
| Pending sales | 749 | 946 | 468 | 84 | 96 | 101 |
| Closed sales | 874 | 991 | 559 | 98 | 101 | 116 |
| Median days on market | about 44 | about 36 | 42 | 57 | 30 | 54 |
| % of last list price | about 98.8% | about 98.8% | 98.7% | 98.5% | 99.7% | 98.9% |
| Months supply | 4.6 | 3.9 | 4.4 | 5.4 | 4.9 | 4.7 |
*East Metro = Gwinnett, Walton, Newton and Barrow combined. Counts are summed. Medians are closed-sales-weighted approximations of the county medians, and Gwinnett is about two-thirds of closings, so it pulls the combined number toward its own. Source: Georgia MLS (GAMLS) via InfoSparks.
County by County
Where each county topped out
The extremes for each county, January 2020 through September 2026:
| County | Fewest homes for sale | Fastest median DOM | Highest median price | Highest % of last list |
|---|---|---|---|---|
| Gwinnett | 564 (Feb 2021) | 4 days (Apr 2021) | $465,000 (Jun 2025) | 103.0% (May 2022) |
| Walton | 156 (May 2021) | 5 days (Jun 2021) | $453,995 (Jun 2026) | 100.4% (Jul 2021, Apr 2022) |
| Newton | 159 (Feb 2022) | 5 days (Jun 2021) | $334,500 (Oct 2024) | 100.7% (Oct 2021) |
| Barrow | 88 (Apr 2021) | 5 days (Apr, Jun, Aug 2021) | $397,450 (Sep 2025) | 101.4% (Aug 2021) |
Notice Walton. Its highest median of the whole six years came in June 2026. Every county peaked on its own schedule. That’s why “the market” is never one number. Your street matters.
Sellers: price it right on day one
- You have 4,442 competitors. In February 2021 you had about a thousand. Buyers can compare now, and they do.
- The market got honest. The typical sale closes at about 98.8% of the final asking price. The data can’t show how many sellers had to cut to get there. Don’t be one of them.
- Time costs money. Median days on market is about 44. Every price cut you could have avoided is time you gave away. Here’s what overpricing cost one Loganville seller.
- Know your county. Newton homes went under contract in a median of 30 days in September 2026. Walton took 57. Same metro, different game.
- Your equity is probably still there. The combined median is still about $118K above September 2020. If you’re weighing timing, read Is now a good time to sell in Loganville?
For Buyers
Buyers: the most breathing room in six years
Months supply hit 4.6 in September 2026, the highest of any month in this data. In February 2021 it was 0.67. You couldn’t think. Now you can.
- Negotiation is back. In May 2022 the typical buyer paid about 102.1% of the last asking price. Now it’s about 98.8%, and that’s off the last price, after any cuts.
- You’ve got time to look. About 44 days median to an accepted offer. Not 5.
- Prices didn’t collapse, so don’t wait for that. About $398K today vs. about $280K in September 2020. The deal isn’t a crash. The deal is leverage: inspections, repairs, terms.
- Watch the price points. Buyers are shifting where they shop by price, not just by town. See the price points East Metro buyers are leaving.
Buying your first home? Start with our Georgia first-time homebuyer guide. Budgeting by county? See our Georgia property tax rates by county.
FAQ
Straight answers
Is the East Metro Atlanta housing market crashing?
The data doesn’t show a crash. The combined median sold price was about $398K in September 2026, below the June 2025 peak of about $435K but well above about $280K in September 2020. Median price per square foot was about $175.5, vs. about $174.3 a year earlier. What changed most is supply and pace, not price.
How many homes are for sale in East Metro right now?
4,442 single-family homes were active at the end of September 2026 across Gwinnett, Walton, Newton and Barrow. That’s the highest month-end count since January 2020. The low was 1,001 in February 2021.
What does “months supply” mean?
It’s the number of homes for sale divided by the average monthly pending sales over the past 12 months. In plain English: how long the current shelf would last at the recent pace of contracts. East Metro was at 4.6 in September 2026, 3.9 a year earlier and 1.3 in September 2020.
Are sellers cutting prices?
This MLS data doesn’t measure price cuts directly. What it shows is the median sale as a percent of the last list price, about 98.8% in September 2026. Because that compares to the final asking price, any earlier cuts are not visible in it. Ask us for a list-to-sale history on your specific neighborhood.
Which county is moving fastest?
In September 2026, Newton had the lowest median days on market at 30, followed by Gwinnett at 42, Barrow at 54 and Walton at 57.
Does a slower market mean I should wait to sell?
Not by itself. A slower market rewards sellers who price right from the start. Get a real number for your home first, then decide on timing. Online estimates are a starting point at best (here’s why).
Your Home’s Value
What’s your home worth in this market?
The county numbers are the backdrop. Your price comes from your street. Get your number, free and no pressure.
Get My Home ValueKeep Reading
- September 2026 Market Update: Loganville, Snellville, Monroe & Grayson
- Is Now a Good Time to Sell a Home in Loganville, GA? (2026)
- The Real Cost of Overpricing Your Home in Loganville: A $118,000 Case Study
- East Metro Buyers Aren’t Leaving Neighborhoods. They’re Leaving Price Points.
- Georgia First-Time Homebuyer Guide
- Why a Zillow Zestimate Is a Terrible Way to Price Your Home
- Living in Snellville, GA: Pros, Cons, Schools & Commute

About the Author
Chris Davis, Associate Broker
Chris and Kristen Davis have 37 years of combined experience in East Metro Atlanta real estate (read the story). Chris is an Associate Broker with The Davis Team at Keller Williams Atlanta Partners (GA License #327023), with nearly 1,000 closed transactions. Across Gwinnett, Walton, and Newton counties he’s known as “the answer man.”
3455 Hwy 81, Loganville, GA 30052
(770) 833-5965 · chris@eastgahomes.com
Sources
- Source: Georgia MLS (GAMLS) via InfoSparks/ShowingTime+, single-family residential, Jan 2020–Sep 2026; pulled Oct 23, 2026. Compiled by The Davis Team. Information deemed reliable but not guaranteed.
- Metric definitions: GAMLS InfoSparks manual. Days on market is median cumulative days to accepted offer. Active listings are counted at month end. Months supply is active listings divided by the trailing 12-month average of pending sales. % of last list price ignores earlier price changes. Combined East Metro medians are closed-sales-weighted approximations. The most recent 1 to 3 months may be revised. Prices do not reflect seller concessions.