Quick Answer
An analysis of 1,302 sold homes in Walton County from GAMLS data reveals the 8 features buyers are most consistently paying a premium for: new construction (+$144K avg), large lots (+$115K), pool community (+$83K), brick exterior (+$64K), finished basement (+$40K), fenced yard (26% faster close), no-HOA positioning (25% faster close), and move-in ready finishes (98.4% of list price at close).
If you’re selling a home in Monroe, Loganville, or anywhere in Walton County, you have exactly one shot to price it right and position it correctly. Buyers in 2025–2026 are not buying potential — they’re buying proof. They’ve been burned by rate locks, appraisal gaps, and overpriced listings that sat for 90 days. They know what they want, and the data shows exactly what they’ll pay extra for.
We pulled 1,302 closed sales from the GAMLS dataset covering Walton County residential transactions — and the results are clear. Here’s what buyers are actually paying for, ranked by impact on your final close price.
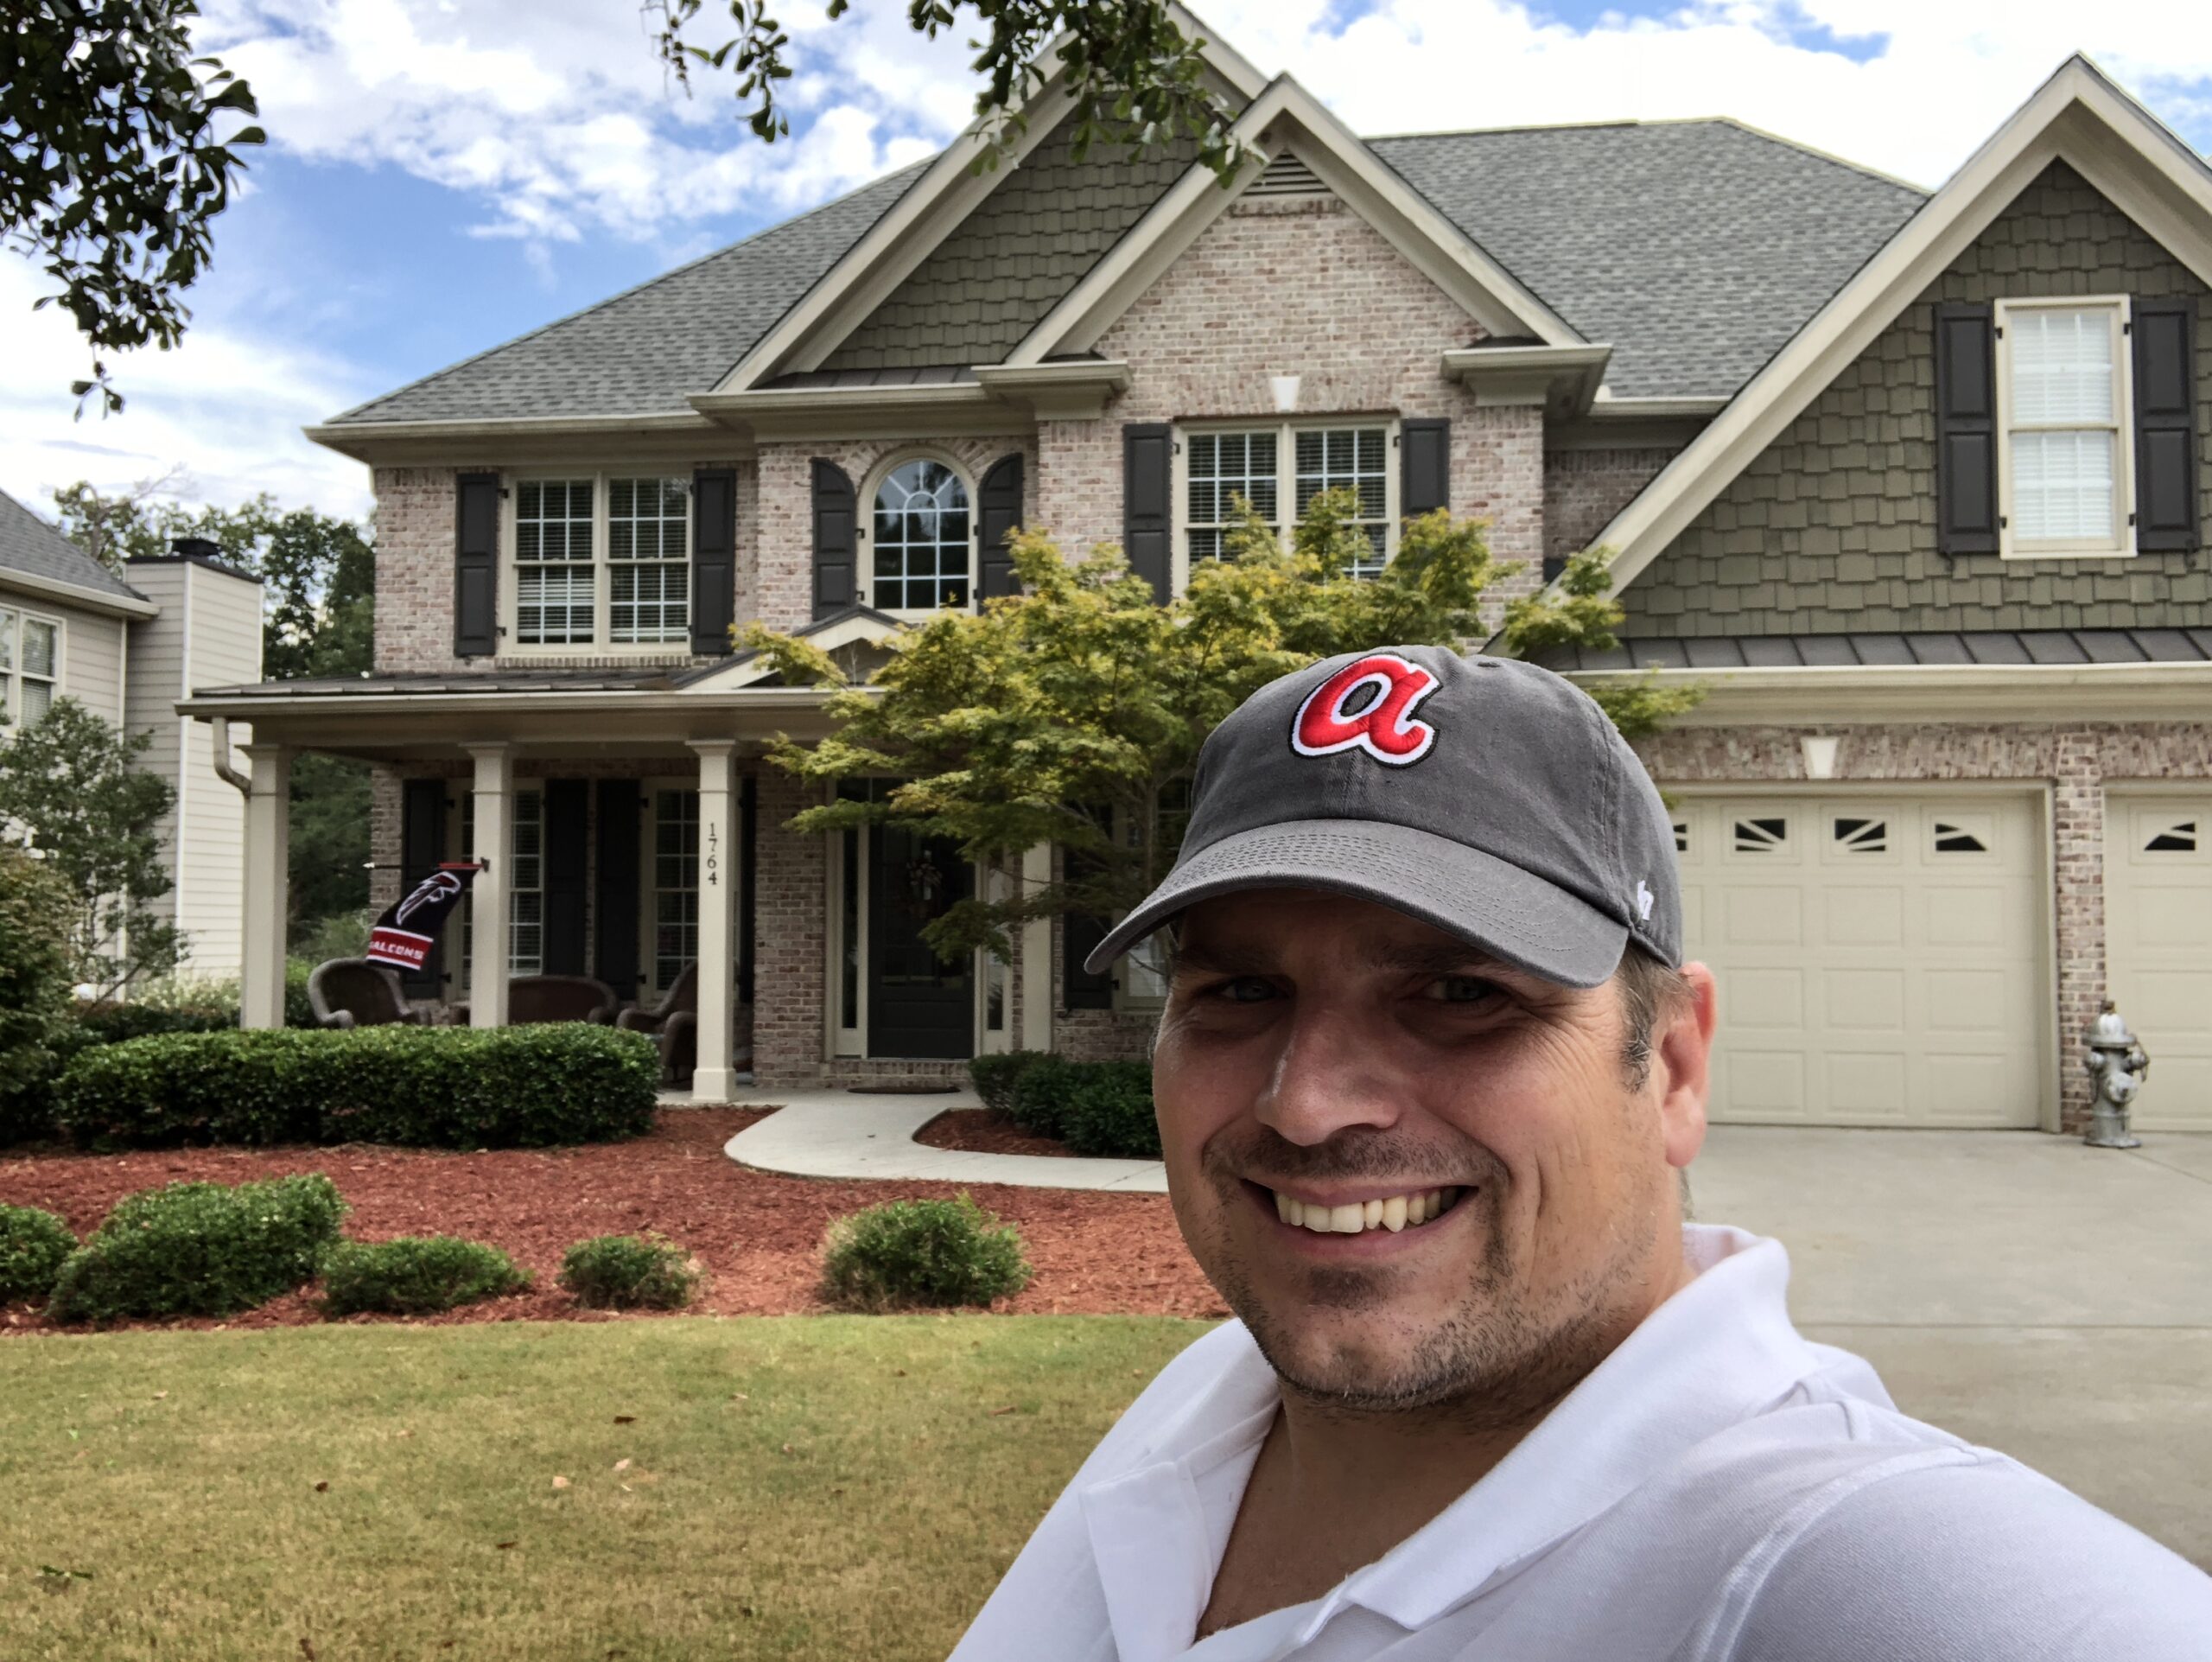
Data source: GAMLS closed residential transactions, Walton County, GA. All figures based on final close price and MLS recorded features.
#1 — New Construction or Built 2020+ (+$144,180 Avg Premium)
This is the single biggest separator in the Walton County dataset. Homes built in 2020 or later averaged $553,020 at close, compared to $408,840 for pre-2020 construction — a gap of over $144,000. That’s not just about new materials. Buyers are paying for warranties, energy efficiency, open-concept layouts, and the avoidance of deferred maintenance.
What sellers can do with this: If your home was built between 2015–2022 and has been well-maintained, you’re closer to the new-construction buyer than you might think. Staging matters. Removing dated light fixtures, replacing builder-grade hardware, and refreshing paint can shift buyer perception meaningfully — and that perception shift reflects in offers.
#2 — Large Lots (1+ Acre) — +$115,489 Avg Premium
Land is the one thing they can’t make more of inside Walton County’s most desirable zip codes. Homes on lots of one acre or more averaged $513,192 at close — versus $397,703 for homes on sub-acre lots. That’s a $115K difference driven entirely by lot size.
Nearly 47.6% of all sold homes in this dataset sat on 1+ acres. This is the Walton County market — buyers come here specifically for space, privacy, and room to breathe. Homes on larger parcels in Monroe and the Social Circle area are particularly well-positioned, with buyers consistently willing to cross the $500K threshold when the lot can support outbuildings, gardens, or future shop space.
#3 — Pool or Pool Community — +$82,566 Avg Premium
Homes in communities with pools — or with a private pool on the property — averaged $512,555 at close, compared to $429,989 for homes without any pool access. In a Georgia summer, that premium makes complete sense. And the data backs it up across 358 sold transactions.
According to the National Association of Realtors, community amenities — particularly pools — consistently rank among the top features buyers prioritize in suburban markets. In Walton County specifically, subdivisions like Alcovy Bluffs with pool and tennis are commanding strong close prices relative to similarly-sized homes in non-amenity communities.
#4 — Brick Construction — +$64,362 Avg Premium
Brick commands a clear premium in this market. Homes with brick in their construction materials averaged $492,733 at close versus $428,371 for non-brick homes — across 492 sold transactions. That’s a $64K difference that speaks to both durability perception and long-term maintenance savings buyers are calculating into their offers.
This includes both full brick and brick-front homes — so even partial brick elevations are contributing to a price premium. Georgia buyers associate brick with quality, permanence, and reduced exterior maintenance compared to vinyl or hardboard siding. Brick 4-Side Ranch, the Georgia classic, consistently appears among top-performing style categories in Walton County data.
#5 — Finished Basement — +$40,580 Avg Premium
Of the 1,302 sold homes, 39.2% had some form of basement — and those homes consistently outpriced non-basement properties. Homes with basements averaged $477,345 at close vs $436,765 for homes without — a premium of over $40,500.
Fully finished basements with bedrooms, bathrooms, and secondary kitchens — often marketed as in-law suites or multigenerational living spaces — are among the most-searched features in the Atlanta metro suburban market. With multigenerational households growing across the country, buyers are actively seeking this flexibility.
#6 — Fenced Yard — Closes 26% Faster
Speed matters. Homes with a fenced yard mentioned in their listing remarks averaged just 45 days on market before closing — compared to 61 days for homes without. That 16-day difference translates to meaningful savings in carrying costs, reduced price reduction pressure, and a stronger negotiating position for sellers.
Fencing is a $5,000–$15,000 improvement that signals safety, privacy, and pet/child-friendliness in buyer’s minds — three of the most emotionally charged checklist items. 27.3% of all sold homes in the GAMLS dataset featured fenced yards, and they consistently moved faster than the overall market average.
#7 — No HOA or Low Restriction — Closes 25% Faster
Buyers searching specifically for “no HOA” are among the most motivated in the Walton County market — and the data proves it. Listings that explicitly marketed no-HOA or no-restriction status averaged just 44 days on market, versus 59 days for HOA-community homes. That’s a 25% speed advantage.
13.2% of sold homes in this dataset had no HOA, and they punched above their weight in velocity. Buyers pursuing acreage, workshop space, short-term rentals, or simply the freedom to park a boat in the driveway are actively searching for this. The $400K–$550K range for no-HOA homes in the Monroe area is particularly active, as buyers weigh HOA fees and restrictions against the total cost of ownership.
#8 — Move-In Ready Presentation — 98.4% of List Price at Close
Every seller wants to know: will buyers pay full price? In Walton County, the answer is almost — across 1,302 sold homes, the average close price was 98.4% of final list price. But that aggregate masks an important truth: homes marketed as “move-in ready” closed in an average of 53 days versus 58 days for others — and more importantly, they avoided the price reduction cycle that pushed other homes down.
One of the most counter-intuitive findings in this data: homes that offered concessions closed at 99.0% of list price, while homes without concessions averaged 97.0%. This is because sellers who price to market, then offer concessions strategically (closing costs, rate buydowns), attract more qualified buyers and generate stronger offers. They don’t discount their list price — they add buyer incentives that don’t show up as a price cut.
Move-in ready means: fresh paint in neutral tones, clean grout, no leaking faucets, no deferred exterior maintenance. The mortgage rate environment has made buyer concessions — especially 2/1 buydowns — a powerful seller tool that moves buyers off the fence without permanently reducing your price.
The Full Cheat Sheet: All 8 Features at a Glance
| # | Feature | Impact | Homes Analyzed | Seller Priority |
|---|---|---|---|---|
| 1 | New Construction (Built 2020+) | +$144,180 avg | 396 sold | Lead all marketing with build year |
| 2 | Large Lot — 1+ Acre | +$115,489 avg | 620 sold | Lead with acreage in headline |
| 3 | Pool / Pool Community | +$82,566 avg | 358 sold | Photo every amenity; mention in remarks |
| 4 | Brick Construction | +$64,362 avg | 492 sold | Lead photo = front elevation |
| 5 | Finished Basement | +$40,580 avg | 511 sold | Stage it — don’t leave it as storage |
| 6 | Fenced Yard | 26% faster close (45 vs 61 days) |
Significant sample | Feature prominently in photos |
| 7 | No HOA / No Restrictions | 25% faster close (44 vs 59 days) |
13.2% of sold | Put “No HOA” in the headline |
| 8 | Move-In Ready + Strategic Concessions | 99.0% of list price | 909 sales | Pre-list invest + offer concessions |
| Data source: GAMLS residential closed transactions, Walton County, GA. Analysis by Chris Davis / Davis Team at Keller Williams Atlanta Partners. | ||||
Monroe vs. Loganville: Which City Is Producing Bigger Closes?
Both cities are well-represented in the closed sales data, and the numbers tell a nuanced story about where buyer demand is concentrated.
Monroe’s higher average close (vs. Loganville’s higher median) reflects a broader range of luxury and estate properties in the $500K–$1M+ tier. Loganville’s tighter median-to-average gap suggests a more consistent mid-market — strong for sellers in the $380K–$480K range who want predictable pricing. See the full Monroe market report for city-specific trend data.

We’ll run a full comparable analysis — not a Zestimate — and show you exactly which of these 8 features you have, how they’re priced in your neighborhood right now, and what your real walk-away number looks like after commissions and costs.
Chris Davis · REALTOR® GA #327023 · Davis Team at Keller Williams Atlanta Partners
Frequently Asked Questions — Walton County Home Sellers
Browse Active Walton County Listings
See what’s on the market right now — filtered by all the features that matter.
Data sourced from GAMLS closed residential transactions, Walton County, GA. Market statistics represent historical transaction data and do not guarantee future performance. For a personalized pricing analysis, contact the Davis Team at Keller Williams Atlanta Partners.